In the era of technology, most of all, business relies on application performance monitoring tools and other software. It saves you lots of time and optimize the task and shows the highest prioritized task on the top of the list to ease your work. So today, we are here with the best application monitoring tools for you.
Recommended: Best Network Monitoring Tools

What Is An Application Performance Monitoring Tool?
Contents
- 1 What Is An Application Performance Monitoring Tool?
-
2 Best Application Performance Monitoring Tool
- 2.1 #1. Site24x7 Application Performance Monitoring
- 2.2 #2. ManageEngine Applications Manager
- 2.3 #3. New Relic
- 2.4 #4. eG Innovations
- 2.5 #5. AppDynamics
- 2.6 #6. Dell Foglight
- 2.7 #7. Opsview
- 2.8 #8. Zenoss
- 2.9 #9. Dynatrace
- 2.10 #10. Stackify Retrace
- 2.11 #11. Traceview
- 2.12 #12. Application Insights
- 2.13 #13. Lightstep
APM or Application Performance Monitoring app developed to manage the performance various task, including the performance of your code, transaction times, application dependencies, and overall UX.
Best APM tools ensure that the development process of application is on the right track, and the developer needs to carry on the process. It requires lots of data to check the performance of a mobile app and operation of it. And APM tool does the same without any hassle.
For constant monitoring of the system, the biggest companies need the performance monitoring tool. These tools optimize the It operations to manage the system without any error.
Here we have covered a total of three different types of monitoring and managing apps for you that perform best and known in the same field. So without wasting time, let’s move to the main section of this article.
Recommended: Best IT Service Desk Software
Best Application Performance Monitoring Tool
In this section, you will find complete details of the best 10 application monitoring (APM) tools with its key features.
#1. Site24x7 Application Performance Monitoring
Website: https://www.site24x7.com/application-performance-monitoring.html

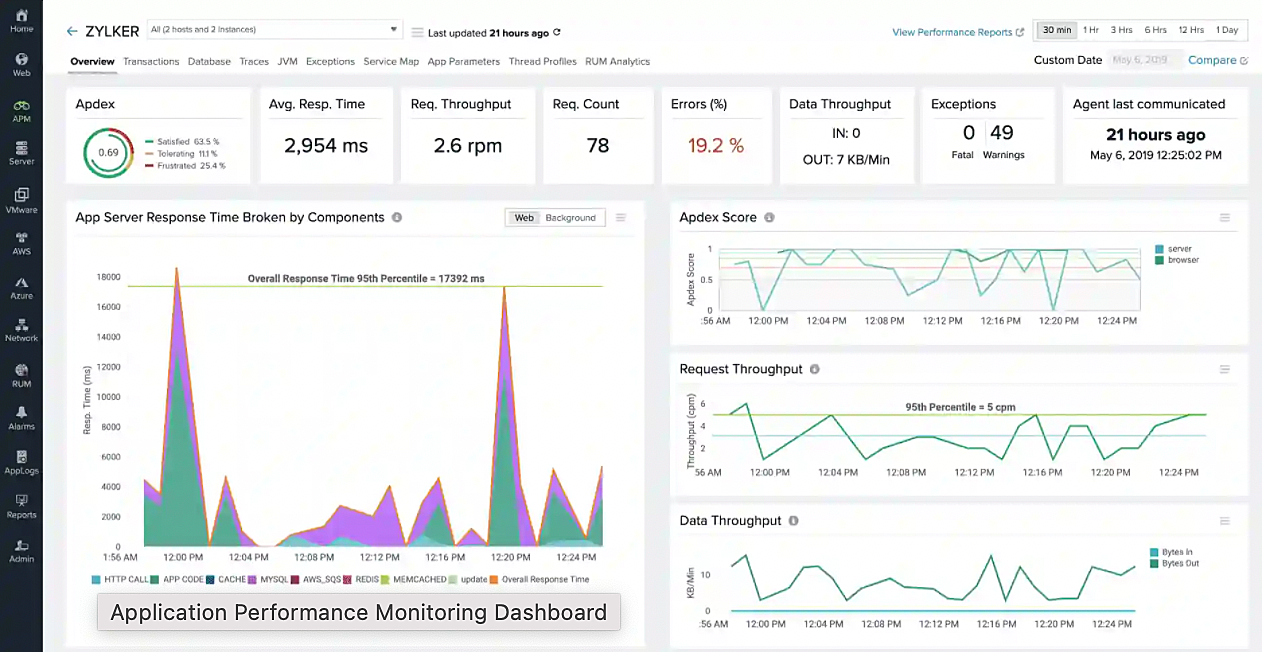
Site24x7 is an AI-powered full-stack monitoring platform from ManageEngine, the IT management division of Zoho Corporation. This cloud-based solution offers IT operations and DevOps teams a broad set of capabilities to quickly troubleshoot problems with the end-user experience, applications, servers, public clouds, and network infrastructures all from a single dashboard. Site24x7 is hosted on Zoho Corporation’s data centers (both primary and secondary) in the USA, Europe, India, Australia, and China.
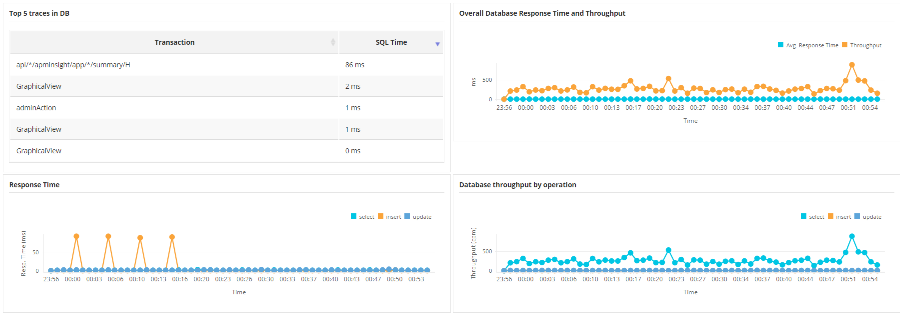
Site24x7 APM Insight is a comprehensive application performance monitoring tool that leverages telemetry data and captures a variety of business-critical metrics to analyze an application’s overall health. It identifies issues before they affect real users, helping optimize application performance.
Key features
- Monitor any application with extreme precision. Site24x7 APM Insights supports various platforms including Java, .NET, .NET Core, PHP, Node.js, Python, and Ruby.
- Integrate application performance monitoring with real-user monitoring to get a 360-degree view of the application’s front-end and back-end performance.
- Integrate with cloud services like AWS, Azure, and GCP and containerized environments like Kubernetes and Docker to track performance across various infrastructure stacks.
- Monitor the end-user experience in real time and synthetically from over 120 geographies.
- Detect anomalies and initiate troubleshooting instantly with help from our anomaly detection engine.
#2. ManageEngine Applications Manager
View Website
ManageEngine is the enterprise IT management division of Zoho Corporation. Established and emerging enterprises—including 9 of every 10 fortune 100 organizations—rely on our real-time IT management tools to ensure optimal performance of their IT infrastructure, including networks, servers, applications, desktops, and more.
ManageEngine Applications Manager is a comprehensive application performance monitoring software built for today’s complex, dynamic environments. It gives deep performance insight into business critical applications—both within the data center and on the cloud. It is easy to use and can be set up in minutes.

Notable Features
- Agent based monitoring with byte-code instrumentation and code-level diagnostics for Java, .NET, PHP, Node.js and Ruby applications.
- Synthetic transaction monitoring from multiple geographical locations for multi-page end-user workflow simulation.
- Out-of-the box support for over a hundred applications and infrastructure elements.
- Extensively monitor hybrid cloud, virtual and container technologies such as Kubernetes and Docker.
- Identify and resolve the root-cause of issues faster with automated application discovery, tracing and diagnostics (ADTD).
- Anticipate future resource utilization and growth with machine learning enabled analytics.
Applications Manager is used by users in varied roles such as IT Operations, DBAs, DevOps engineers, Site Reliability Engineers, application developers, application owners, Cloud Ops, etc. in 5000+ businesses worldwide.
#3. New Relic
Website: https://newrelic.com/
Lw Cirne developed New Relic in 2008, and within no time it grows and becomes one of the essential tools for developers, business executives, and support teams of IT. Today thousands of customers are using its service to manage and improve the application or software performance.
It spread all over the world, and its offices are located in Portland, San Francisco, Sydney, Dublin, Zurich, London, and Munich. With the fantastic growth rate and 35.51 crores USD revenue according to March 2018 data, and it has a year on year growth of 34.97 %.
New Relic APM gives the facility to find out the problem in the application and related problems in it.
Thee performance-related matrices that given below by New Relic:
- Response Time, Error Rates, Throughput, etc.
- Transaction breakdown
- Most time-consuming transactions
- Performance of external services
- Cross-Application Tracing
- Deployment Analysis, Comparison, and History
- It supports language like Python, Java, .net, Ruby, and PHP.
With this app, you can get performance monitoring for mobile apps, infrastructure monitoring, and advanced browser performance.
#4. eG Innovations
Website: https://www.eginnovations.com/
In application performance and IT infrastructure, eG Innovations is an industry leader. Founded in 2001, and with constant updates and excellent features that have expanded their portfolio over the years.
At present, they can monitor more than 180 apps. SharePoint, Java, SAP, .NET, and Office 365 are few names of the list. Hundreds of known companies are using eG Innovations’ performance monitoring software application around the world.
This software provides a promising solution to solve their IT challenges like code-level errors, downtime, slow apps, capacity issues, config changes, hardware faults, and so on.
It helps the developers, application managers, software development and information technology operations personnel, and IT operations personnel to find out the root cause of the issue in application performance to troubleshoot it quickly.
Notable Features:
- Monitor the digital experience of users and find out where the experience is affected
- Using distributed transaction tracing Get code-level visibility into applications and find out the reasons for slowness: slow queries, code errors, slow remote calls, etc.
- Auto-discover dependencies between the underlying components like cloud, container, visualization, network, etc. and applications and create topology maps
- Advantage from throughout performance insight into the application infrastructure: CLRs, JVMs, application servers, databases, message queues, and more
- Using the built-in correlative intelligence and machine learning, it bifurcates the root cause of performance slowdowns
#5. AppDynamics
Website: https://www.appdynamics.com/
AppDynamics was founded in 2008 and is an American Application Performance Management Company based out of San Francisco.
According to owler.com, they are dealing with $143.3M revenue at present and ranked on the ninth position according to the Forbes list among 100 top Cloud companies.
It is part of Cisco now that provides end to end and real-time performance update for all complex and distributed applications.
Key features:
- Supports languages like .NET, C++, PHP, Java, Node.js and few more
- If it finds any critical issue in working of the app, then sends an alert with automatic performance base-lining
- By monitoring codes in every line, it resolves production application performance issues
- With this application monitoring tools, you can easily find the root cause for error and easily fixed it.
- Appdynmics automatically discover the normal and abnormal in the performance using the alerts and response.
#6. Dell Foglight
Website: https://www.quest.com/foglight/
DELL is known among all the readers due to it’s a multinational computer technology company. It was founded in 1984 and based out of Texas, United States. At present, it has about 138,000 representatives across the world.
In 2012, they acquired Quest Software, which is a leading software for application performance management. This tool monitors the application’s performance using the latest technologies like .net or Java.
With the better user experience, cross-mapping, and analytical dashboard between an application and the database, it is easy to find out the bugs in the application.
It quickly identifies and solves the issues related to the application, database, and virtual environment. It can integrate with the other monitor application performance tools for Infrastructure performance.
Notable Features:
- Foglight supports languages like .NET, Java, AJAX, etc.
- It monitors the performance of the application, storage platform performance, database monitoring, etc.
- It monitors app health by capturing user transactions. It helps to enhance compliance with the end-users service-level agreement
#7. Opsview
Website: https://www.opsview.com/
Launched in 2005 and headquartered Reading, England; Opsview is a software company. The office of Opsview is in Woburn, Massachusetts, United States.
This APM software provides a single view of the performance and the entire infrastructure of business applications.
Yes, it is difficult to get all the data of performance on a single context as multiple applications are used at various locations. But this tool makes it easier by using its unified and automated approach.
Notable Features:
- During the abnormal conditions of application, Opsview tracks the health and alerts so one can solve it before it affects the end user.
- It tracks the availability and connectivity of database with the client and storage metrics.
- It also assured that business-critical applications are meeting their service-level agreements.
- It works with Opsview Mobile
#8. Zenoss
Website: https://www.zenoss.com/
Zenoss is one of the leading names for hybrid IT monitoring and analytics software launched in 2005 and headquartered Austin, Texas, USA. It offers three software which are Zenoss Service dynamics (Commercial software), Zenoss core (Open source), and Zenoss as a Service (ZaaS).
With huge application monitoring capacity, it can monitor17 billion data points and 1.2 million devices per day. This software won the Forbes award for Best Enterprise Software Startups and CEOs to Work For in 2016.
Key Features:
- With protective application monitoring, it reduces the downtime of the application
- With seamless infrastructure, it resolves issues before it impacts the end users.
- It can automatically monitor application and in case of any abnormalities, provides instant alerts and notifications.
- Zenoss can combine with leading APM influencers such as AppDyanmics, New Relic, Dynatrace, etc.
#9. Dynatrace
Website: https://www.dynatrace.com/
It was launched in 2006 and headquartered Massachusetts, USA. At present, about 2000 employees are working in Dynatrace. According to data of the financial year 2018, it has about $28M in revenue according to owler.com.
Dynatrace is one of the APM tools that monitor and manage the software application’s performance. It also makes sure that the software application available all the time. The business transaction, as well as individual transaction, are monitored at the code level by deep diving Dynatrace APM.
It can monitor and shows real-time performance data of the application, infrastructure, and cloud environment.
Key Features:
- It supports .NET and Java language
- Dynatrace APM does end to end and code level monitoring
- It provides better digital customer experience by throughout understanding of the performance of the application for business growth
- Before the end user affects, it solves the problem in the application
- The problem solved quickly and saved the resources to use for resolution and identification of issues.
- AI discover performance issues and gives the best solution.
#10. Stackify Retrace
Website: https://stackify.com/retrace/
Matt Watson launched Stackify in 2012 and headquartered Kansas, USA. With $1 million revenue in 2016, it awarded 2016 Editors’ Choice Award by PC Magazine for its great work of APM.
This performance monitoring software has more than 1000 customers all around the globe that includes small to large organizations. Some of the known names include Xerox, Honeywell, Microsoft, etc.
Key Features:
- It can integrate with other tools and support multiple environments
- Supports trending framework like Java, .NET, and few other
- It designed for developers, and it is a SaaS-based APM tool
- This tool controls the health of various application and servers.
- Retrace recognizes the problems with the help of detailed code level performance trace and solve it quickly before it affects the end user
- From the full details of the application, it can find an impact on the performance of the app.
#11. Traceview
Website: https://traceview.solarwinds.com/
Tracelytics which is now known as Traceview. AppNeta acquired it, a part of SolarWinds. It was found in 1999 and headquartered Texas, USA. With $429 million revenue, it has more than 150 employees that working for Tracelytics.
For web applications, it is one of the outstanding application monitor tools. It provides deep detail of the application and end-user experience. Even it is a cost-effective monitoring tool for application development.
Key Features:
- It supports .NET, Java, PHP, Ruby, Python, etc.
- It monitors all type of SaaS applications and web applications.
- With a detailed level of code, it can monitor the performance of applications
- With real-time monitoring system, it fixes the problem quickly
- For 24*7 support there is an online portal, email and phone support are there.
#12. Application Insights
Website: https://azure.microsoft.com/en-us/services/monitor/
Microsoft is a reputed company that does not need any introduction. With 124,000 employees and $90 billion in revenue, it jumps to the Application Performance Monitoring tool. They give Application Insights name to this tool.
It can easily be organized to find out how applications are performing. It is designed for developers and monitors application performance. It also collects data on the performance of the application and quickly solves the problem.
Key Features:
- Works with C++, .NET, Ruby, PHP, JavaScript, Python, etc
- It works with Android, iOS, and Window-based application
- It can monitor the response time for various requests, network, CPU, memory usage, etc
- It has a robust alerting system like email, response time, various metrics, etc.
- Find the root cause for any problem in the application and fixes it immediately
- It provides multiple dashboard and metrics to assure that an application is running perfectly.
Bonus
#13. Lightstep
Website: https://lightstep.com/
Lightstep is built to help developers deploy with confidence, at scale, without any impact on velocity. With powerful insights, unlimited scalability, predictable pricing, and more. It is the obvious choice to reduce complexity, downtime, and costs all at once. Lightstep can analyze 100% of your unsampled event data in seconds and automatically surfaces the likely root cause, no matter how rare, specific, or deep in the stack it is. Be sure to check out their Interactive Sandbox feature where you can debug an iOS error or resolve a performance regression in under ten minutes and it’s entirely free.
Key Features
- Unlimited tracing
- Unlimited cardinality
- Access to runtime metrics and logs
- Automated root cause analysis
- Automated real-time deployment analysis
- System-wide service diagrams
- Intra-service operations diagrams
- Alerting
- Integrations: PagerDuy, Slack, Istio, and many more
Conclusion:
So with this, we end up our article of top 10 Applicate Performance Monitoring tools with its features. We hope you find it useful. If you want to recommend some more tools to other readers, the comment section is open for you. Thank you!
Related Software:
- Best Server Monitoring Tools
- Best Duplicate File Finder for Windows
- Best Whiteboard Animation Software
- Best Virtual Machine Software for Windows
- Best Photo Management software
Dilip is freelance software and tech content writer. At TopItSoftware mostly write about the best software. In his free time is doing graphic design work.